You can unleash the power of Quantum GIS for your geospatial projects with our detailed QGIS tutorial. QGIS is free and open-source software that allows for creating, editing, and visualizing geospatial data. However, mastering its various features is not easy, especially for beginners.
In this article, you will find a QGIS step-by-step tutorial to better understand the basics of the software. Then, you‘ll learn how to use its various features and tools. This information may help even beginners save time and enhance productivity. So read on and unlock the power of QGIS to take your geospatial projects to a brand-new level!
What Is QGIS?
QGIS is an open-source geospatial software that lets you explore the world from your desktop. It’s perfect for analyzing environmental data, mapping demographic trends, or surveying land boundaries. With QGIS, you can visualize, manage, and manipulate complex geospatial data.
QGIS software helps you create maps, analyze data, and find hidden patterns. It’s easy to use and has lots of helpful resources. You can also join a community of users who share tips and create plugins to make the software even better.
QGIS is a tool for more than just cartographers and GIS professionals. It is a versatile platform for anyone interested in the spatial world. It is valuable for government agencies, researchers, NGOs, and businesses. That’s because it’s flexible and works well with other software. QGIS helps make data-driven decisions and communicate complex information to a wider audience
QGIS Possibilities
QGIS is a versatile platform for working with geospatial data, from basic visualization to advanced analysis. In our QGIS tutorial, we will find out more about the possibilities of this powerful and accessible tool.
Basic
For beginners, QGIS offers a straightforward interface that allows them to create, edit, and visualize geospatial data. Using basic operations, you will be able to work with raster, vector, WMS, and terrain data; calculate line lengths and statistics; and work with attributes and projections.
Intermediate
For users with some experience, QGIS offers advanced data management and analysis features. You can enjoy various tools for spatial analysis, including proximity analysis, terrain analysis, and interpolation. Intermediate operations include creating heatmaps, calculating and sampling raster data, and animating time series data.
Advanced
For experienced users, QGIS offers even more advanced functionality, such as 3D visualization, geostatistics, and remote sensing analysis. These features allow users to analyze and visualize complex spatial patterns and relationships. Users can automate complex workflows and map creation.
Network Analysis
QGIS offers a variety of network analysis tools, including routing, closest facility, and service area analysis. These tools are useful for planning and optimizing transportation and logistics systems. For example, you can enjoy travel time analysis with Uber’s movement.
Hydrology
QGIS provides tools for analyzing hydrological processes like flow accumulation, watershed delineation, and stream network analysis. These tools are useful for understanding and managing water resources.
PyQGIS
QGIS has a Python API called PyQGIS that allows users to automate tasks and extend the software’s functionality. This is particularly useful for advanced users who want to create custom plugins or scripts.
Web Mapping
QGIS allows users to create interactive web maps and publish them online. It supports various web mapping services and formats, such as OpenStreetMap, Google Maps, and GeoJSON.
Appendix
The Appendix section of QGIS provides data credits and learning resources, such as tutorials, sample data, and plugins. They can help users learn more about the software and improve their workflows.
Basic QGIS Operations
In this section, we’ll explore another important aspect of our QGIS tutorial and learn about basic operations in QGIS.
Making a Map
To make a map appealing and informative, you need to select the layers you want to include, pick a map theme, and apply styles and labels.
Working with Attributes
Attributes are the information associated with each feature in a dataset. You can explore and edit attribute tables for vector layers, which contain information about the features in the layer. Spatial join QGIS combines two or more vector layers based on their spatial relationship.
Importing Spreadsheets or CSV Files
QGIS can also import and work with tabular data from external sources, such as spreadsheets or CSV files, into QGIS to use as a layer for further analysis.
Basic Vector Styling
This involves adjusting the appearance of vector layers in QGIS, such as changing the color, thickness, and transparency of lines and polygons to better distinguish features and make them more appealing.
Calculating Line Lengths and Statistics
QGIS can also perform basic spatial analysis functions, such as calculating the length of lines in a layer or summarizing the values of attributes.
Basic Raster Styling and Analysis
You can use QGIS to adjust the color scheme, contrast, and transparency of raster layers. Perform basic analysis functions, such as changing their color schemes or performing simple calculations on the pixel values.
Raster Mosaicing and Clipping
This operation involves combining many raster layers into a single, seamless layer or clipping a raster layer to a specific geographic boundary.
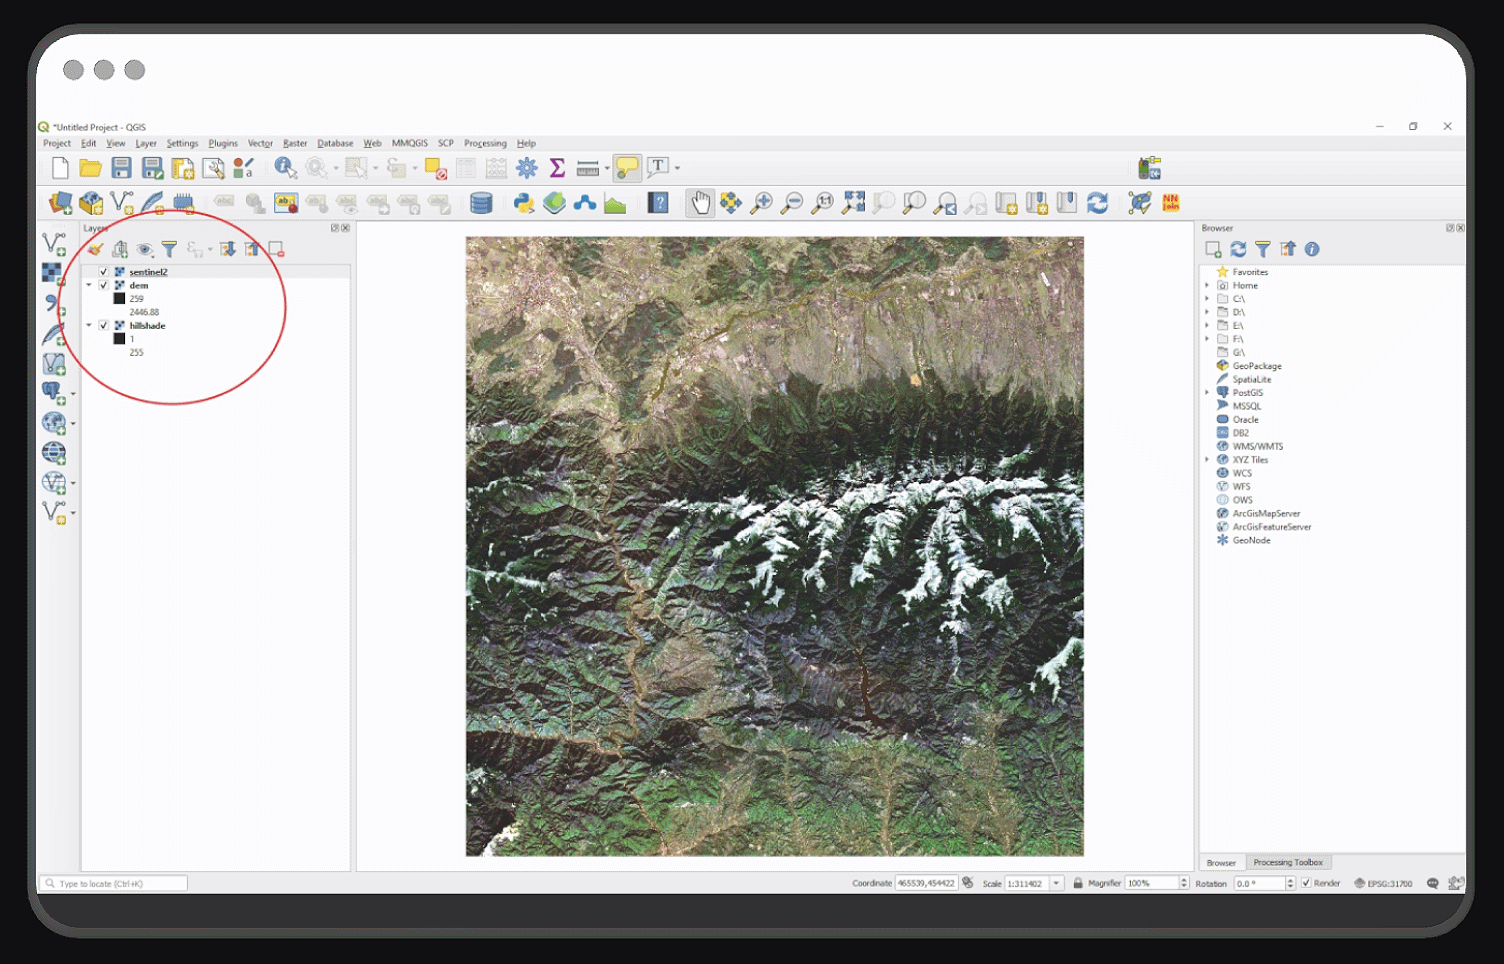
Working with Terrain Data
You can import and visualize terrain data, such as digital elevation models (DEMs), and perform basic analyses on the data.
Working with WMS Data
This involves accessing and using data from web map services (WMS), which provide a way to view and use data from external sources within QGIS.
Working with Projections
QGIS allows for managing and transforming coordinate reference systems (CRS) for layers, which is important for ensuring accurate spatial analysis and visualization.
Georeferencing TopoSheets and Scanned Maps
This operation involves aligning raster images of maps or aerial photographs with real-world geographic coordinates. Then, you can use them as layers in a QGIS project.
Georeferencing Aerial Imagery
Users can georeference aerial photographs or satellite imagery in QGIS for use as layers in a project.
Digitizing Map Data
This involves creating vector features in QGIS, such as adding points, lines, or polygons to represent real-world objects or features.
Searching and Downloading OpenStreetMap Data
You can access and download data from the OpenStreetMap (OSM) project, which provides a collaborative and editable world map.
How to Use QGIS 3?
In our QGIS software tutorial, we’ll cover key steps, from installing the tool to exporting maps. So read on and create your compelling map.
How to Download QGIS3
QGIS tutorial describes the download process. First, you should visit the QGIS download page, select the appropriate version for your operating system, and click on the download link. Once the download is complete, you need to double-click on the downloaded file to launch the installer and follow the on-screen instructions to complete the installation process.
Making a Map
These are the basic steps involved in making a map in QGIS. Next, you should add layers to the map, set up the project properties, arrange the layers, style them, and QGIS add a legend. Finally, export the map as an image, PDF, or other format.
Working with Attributes
Working with attributes in QGIS involves managing the information associated with each layer in your project. Attributes include information such as names, populations, and elevation. You should open the attribute table for the layer of your interest and edit, sort, and filter the data.
Vector Styling & Raster Styling and Analysis
Vector styling changes how vector layers look on maps. Raster styling involves processing and manipulating raster data.
Digitizing Map Data
Digitizing map data is the process of creating new vector layers by tracing over existing maps or aerial imagery. The process involves using QGIS tools to create new vector layers and drawing features like points, lines, and polygons. “QGIS select by location” and “QGIS select by attribute” are both common tools in QGIS for selecting features within a vector layer based on certain criteria. You can manipulate vertices and attribute data for each feature.
Exporting Maps
QGIS tutorial will show you how to export maps. It is the process of saving a map view as an image or a PDF file. To export a map, first, navigate to the “Layout” tab and customize the map view as needed. Then, click on “Export as Image” or “Export as PDF”. Next, select a file name, location, format, and resolution. Finally, click “Save” to export the map.
Downloading Plugins
QGIS plugins offer a variety of tools and features to enhance the software’s functionality. Read the plugin documentation in advance; some may need extra configuration or setup. To download a plugin, use the “Manage and Install Plugins” option in the Plugins menu. Then you can search for plugins by name or by category and click the “Install” button.
Adding a Basemap
Adding a basemap in QGIS is a quick and easy way to add context to your map and help you better understand your data. QGIS tutorial provides three options for adding basemaps in QGIS:
Built-in basemaps: OpenStreetMap, Google Maps, Bing Maps, and more.
Custom basemap URL: you can add it to QGIS by using a URL.
Plugin: QuickMapServices and OpenLayers.
3D Visualization
QGIS 3D visualization allows users to create a 3D scene from spatial data. A 3D view is added to the QGIS interface, where users can add 2D vector layers. Then they extrude them to create 3D objects and import external data sources for a more accurate terrain representation. After that, users can enhance the model’s appearance and interact with the 3D model.
QGIS Plugins: How to Choose
In our QGIS tutorial, you will find useful information on plugins. The plugin architecture ensures you can add many new features and functions to the application. Implement some of the features as plugins. Consider that users can install QGIS plugins either as Core Plugins or External Plugins.
Core Plugins can be written in C++ or Python. The QGIS Development Team maintains them. They are automatically part of every QGIS distribution. External Plugins are mostly written in Python. You can find them in the official repository or in external repositories. To install or activate a plugin, you should go to Plugins. Useful plugin examples include the Raster Terrain Analysis plugin, the OpenLayers Plugin, the GeoSearch Plugin, etc.
But how to decide which one to choose? You should consider several crucial aspects: performance, functionality, compatibility, support, security, and documentation. QGIS core plugins are generally more stable and secure and get regular QGIS updates.
FAQ
Is it easy to learn QGIS?
QGIS is not difficult to master, especially if you have prior experience with GIS software. This free and open-source geographic information system software is intuitive, which makes it perfect for beginners. Besides, a large community of users and developers provides support and resources. You can master advanced features and become proficient in using QGIS by investing some time and effort. QGIS tutorial can help you explore more details on this software.
What is QGIS used for?
Quantum GIS is a free and open-source GIS software used for different tasks related to geospatial data analysis and mapping. You can use it to create, edit, and visualize geospatial data: vector, raster, LiDAR, GPS, remote sensing, and geocoded data. Geocoding, georeferencing, geoprocessing, designing maps, generating reports, cartographic outputs, and many other tasks are easy with QGIS. This tool can help planners, natural resource managers, geologists, and many others better understand geospatial data.
How is QGIS different from ArcGIS?
QGIS and ArcGIS are GIS software used for analyzing and visualizing geospatial data, but there are key differences. QGIS is free and open-source software, while ArcGIS is proprietary software that requires a license to use. QGIS has a user-friendly interface, while ArcGIS has a complex interface. ArcGIS has some advanced features that are not available in QGIS. You can use QGIS on different operating systems. ArcGIS has strong integration with other Esri products, while QGIS has its own plugins.
Why is QGIS popular?
QGIS is a popular GIS software package, and there are several reasons for that. It is free and open-source software, so many users can enjoy it. Another advantage is compatibility with popular operating systems. The software is easy to use and navigate and has a comprehensive range of geospatial functionality. QGIS supports various data formats, which makes it easy to work with data from different sources. Geospatial professionals choose QGIS due to its large and active community.
What are the basics of Quantum GIS?
QGIS is an open-source geographic information system that is compatible with different operating systems. Quantum GIS basics include adding, viewing, and styling data; spatial analysis; geoprocessing; map layout, etc. Many plugins extend QGIS functionality. QGIS tutorial tells us that it allows users to create various outputs. For example, you can export printed maps, web maps, and reports in different formats.
Conclusion
We can sum up that QGIS is a gateway to a world of spatial possibilities, offering a unique combination of power, flexibility, and accessibility that sets it apart from other geospatial software. This QGIS tutorial provides a detailed overview of QGIS, its possibilities, basic operations, plugins, and work principle. We hope this information will help you create successful geospatial projects with QGIS.
Why to Choose Mappitall for Mapping with QGIS
Mappitall is a reliable solution for your geospatial projects. Mappitall is a trusted company that provides mapping services using the latest tools and technology, like QGIS. Our team has completed 87 successful projects, specializing in 2D & 3D digital mapping, indoor mapping, cartography vectorization, and web app development. We work with various industries, such as tourism, real estate, agriculture, and sustainable energy, and aim to create customized solutions that meet your needs. We take pride in delivering high-quality projects that meet the highest standards.
Do not hesitate to contact our professional developers for QGIS mapping. Mappitall will deliver a modern GIS mapping solution, regardless of the project’s complexity.
Get in touch with us
Want to discuss your project?
Use our expertise to design your custom mapping software solution.
Just contact us:
Tell us about your project goals, and we’ll get back to you in no time!
An entrepreneur and business leader, Volodymyr began his career in the late 1990s at the Laboratory of Geoinformation Systems of the Kharkiv National University of Radioelectronics.
In 2007 Volodymyr created Mappitall, and grew the company from a small agency providing GIS solutions to one of the industry leaders in Ukraine, a reliable technology partner for many international enterprises and top-level organizations around the world.
As CEO, Volodymyr is the driving force behind the company’s strategy and business development, actively working on the development of Mappitall’s business model, attracting more and more talented people who share his vision and mission.