GIS software development, GIS database design, Spatial data analysis, GIS consulting

2D/3D digital mapping, Indoor mapping, Cartography vectorization, Web map development

LiDAR data processing and conversion, Georectification and georeferencing, Vectorization and digitization, Data integration

Data capture and verification, Spatial data analysis, Cartography and mapping consulting, GIS web & app consulting

Floor plans digitalization, Indoor navigation, Building Information Model (BIM)

Data acquisition and digitization, Data conversion, Data cleansing and quality audit, Geospatial modeling and analysis

Jornal da Cidade - 6
Home
Cases

Jornal da Cidade

GIS toolkit for
Jornal da Cidade

Displaying layers on the map with statistical data on population and density in the city
PROJECT NAME Jornal da Cidade
Displaying layers on the map with statistical data on population and density in the city
Country:
Mozambique
Industry:
Information
Project Status:
2021
Front end:
Jornal da Cidade - 7

Leafletjs

Jornal da Cidade - 8Jornal da Cidade - 9

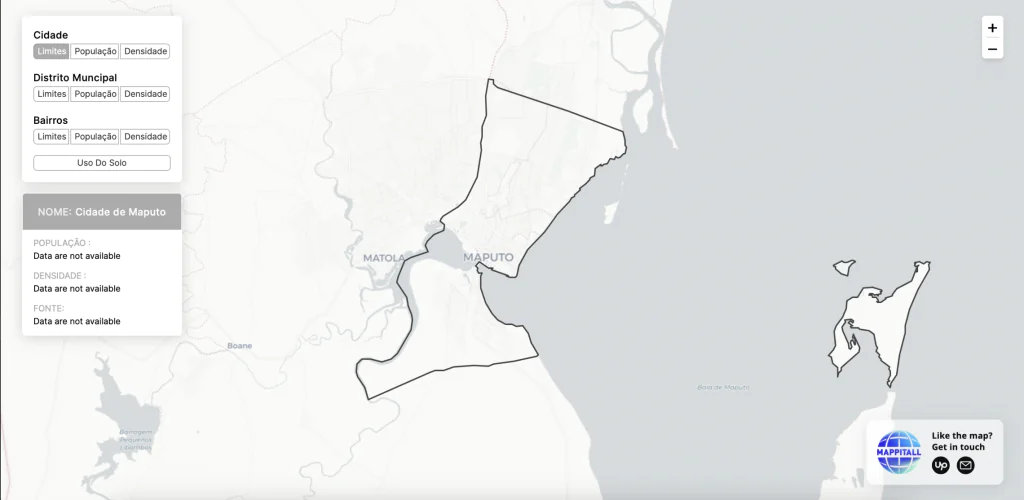
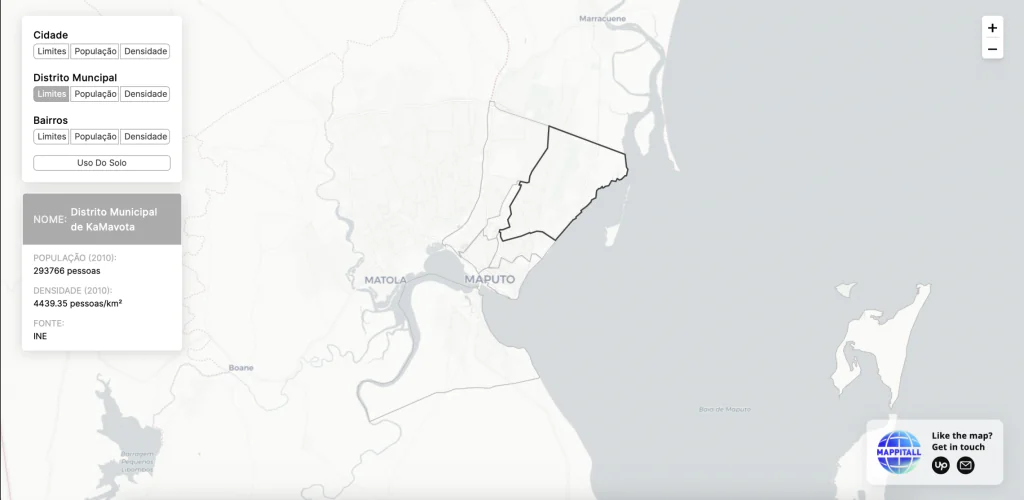
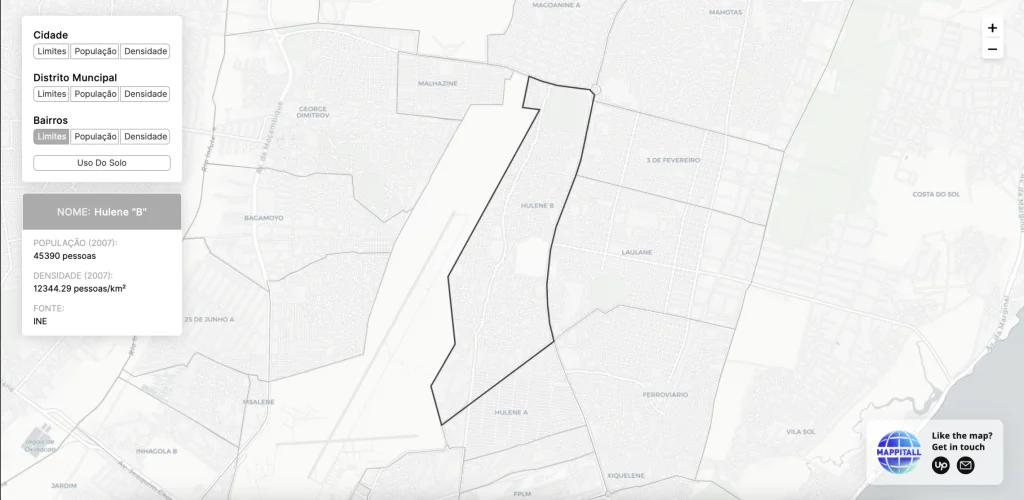
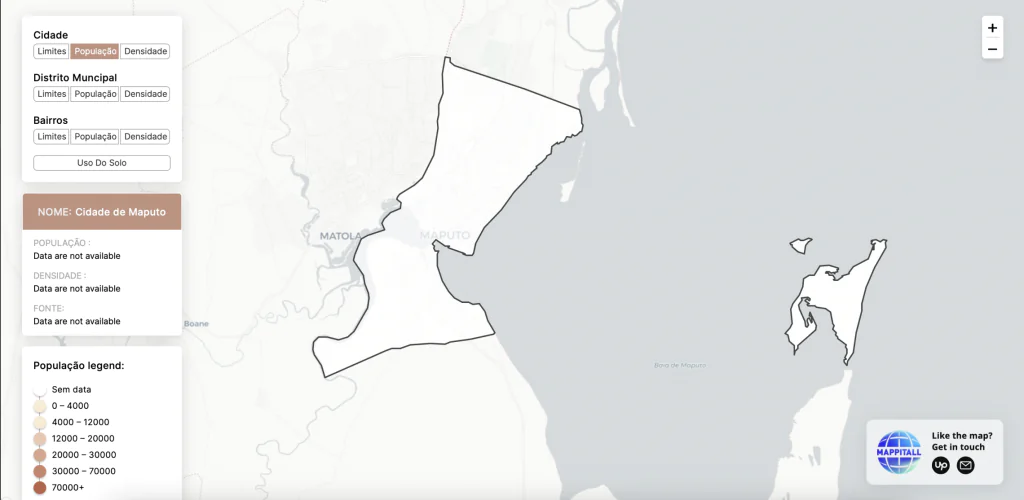
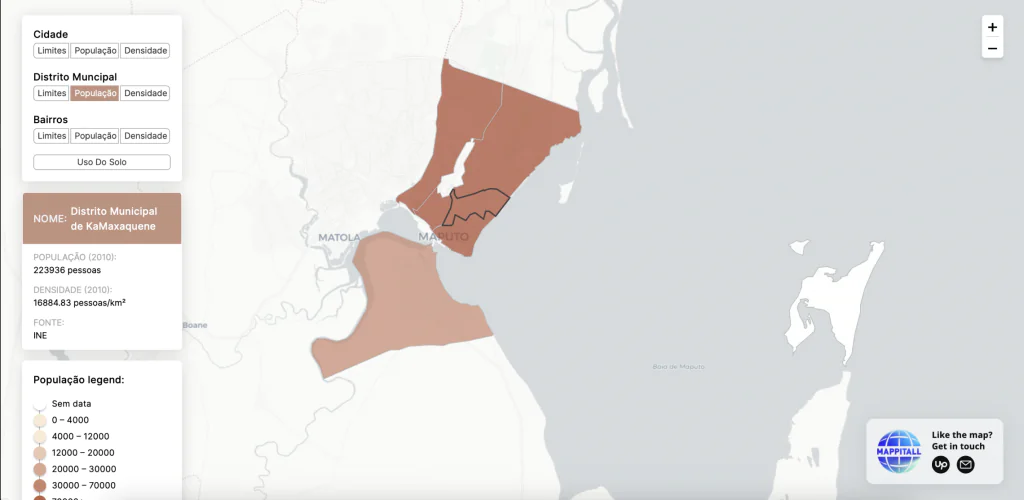
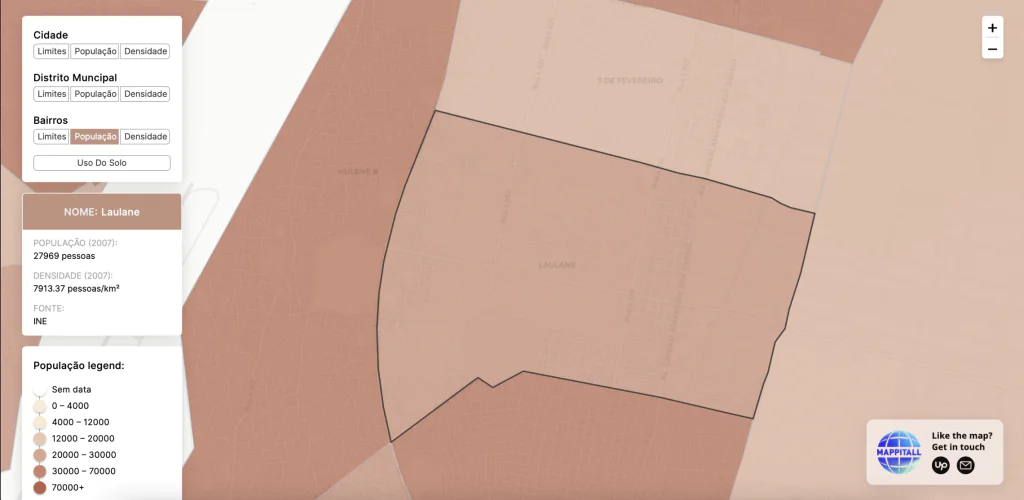
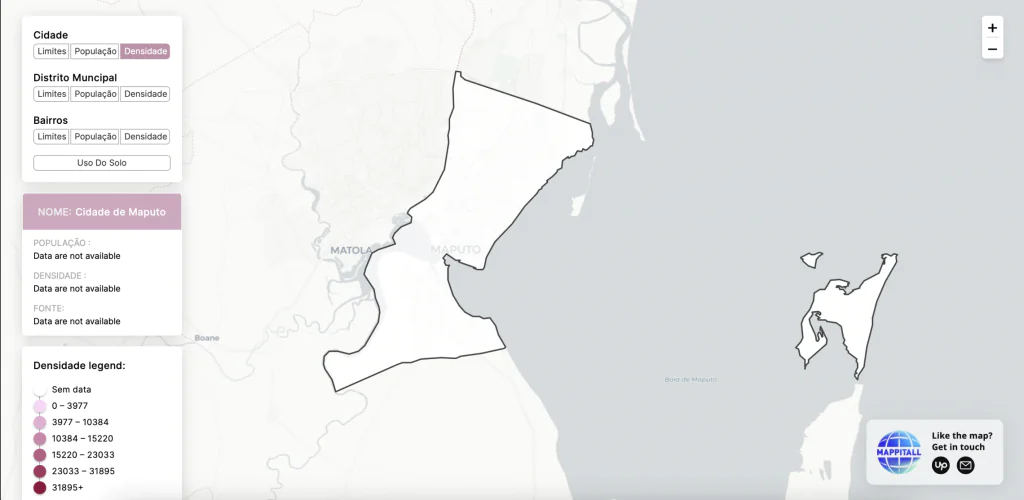
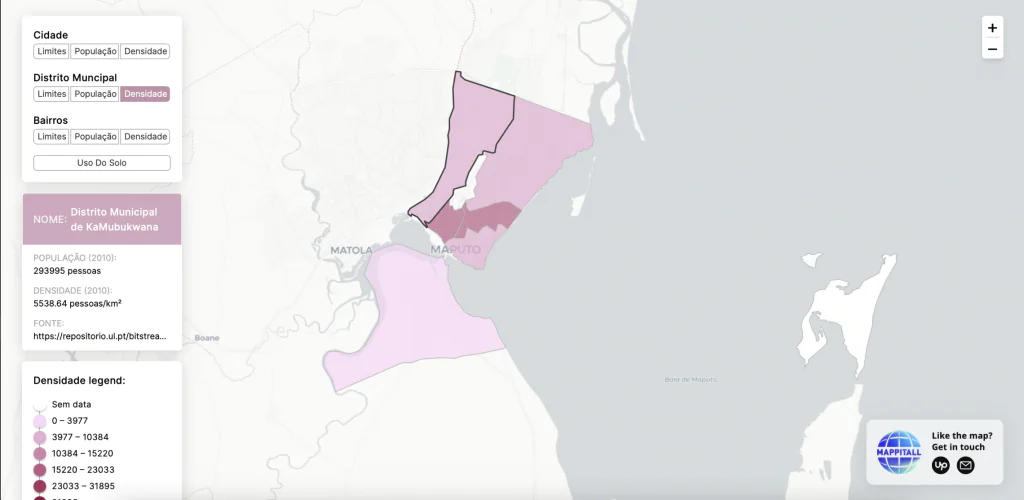
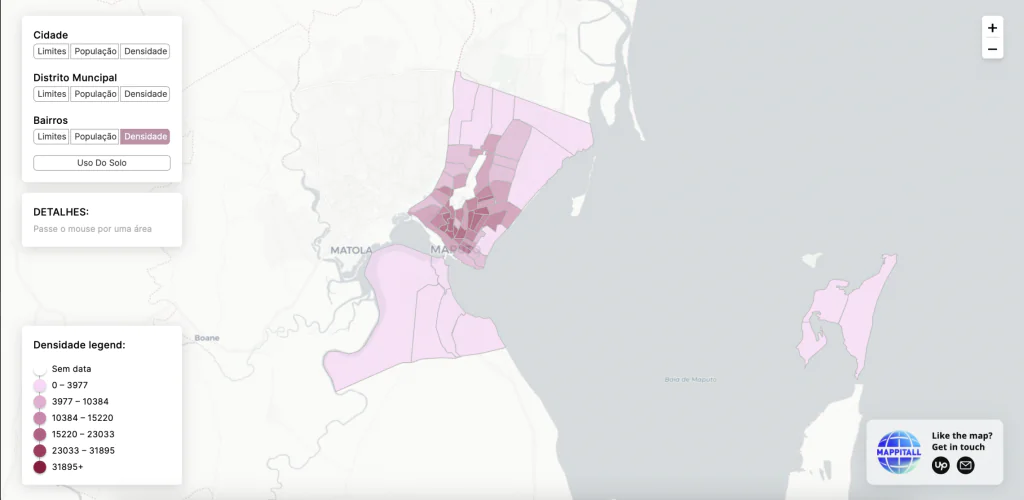
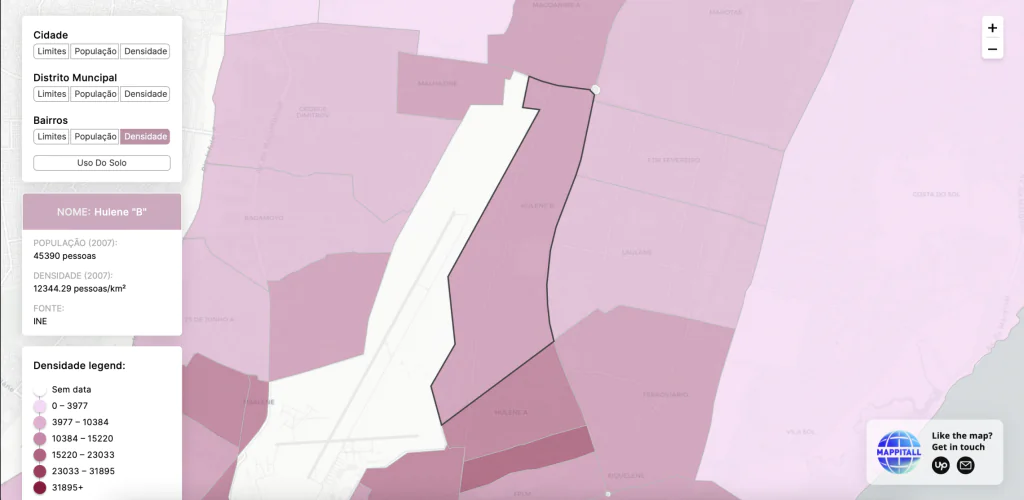
Slide 1/11: Polygon maps with general population and density data in the cidade Maputo

Jornal da Cidade - 10Jornal da Cidade - 11

Slide 2/11: Polygon maps by districts (distrito) with general population and density data

Jornal da Cidade - 12Jornal da Cidade - 13

Slide 3/11: Polygon maps by neighborhoods (bairros) with population and density data

Jornal da Cidade - 14Jornal da Cidade - 15

Slide 4/11: Polygon maps with general population data in the city (cidade) Maputo

Jornal da Cidade - 16Jornal da Cidade - 17

Slide 5/11: Polygon maps by districts (distrito) with population data

Jornal da Cidade - 18Jornal da Cidade - 19

Slide 6/11: Polygon maps by neighborhoods (bairros) with population data

Jornal da Cidade - 20Jornal da Cidade - 21

Slide 7/11: Polygon maps with general density data in the city (cidade) Maputo

Jornal da Cidade - 22Jornal da Cidade - 23

Slide 8/11: Polygon maps by districts (distrito) with density data

Jornal da Cidade - 24Jornal da Cidade - 25

Slide 9/11: Polygon maps by neighborhoods (bairros) with density data

Jornal da Cidade - 26Jornal da Cidade - 27

Slide 10/11: Polygon maps by neighborhoods (bairros) with density data (zooming)

Jornal da Cidade - 28Jornal da Cidade - 29

Slide 11/11: Polygon maps with land use data

decor
Mappitall cases

Related Case Studies

Jornal da Cidade - 31

Mapping Out the Crime and Arrest Data Statistics

Civic Hub is a San Francisco-based think tank and incubator for projects that improve quality of life using technology. The company partnered with Mappitall to enhance their SF Crime and Arrest Data Project with an interactive map.

Read More
Jornal da Cidade - 32

Paving the way to sustainability with a smart mapping solution

The San Francisco Public Utilities Commission (SFPUC) Rain Guardians Program presents a map of rain gardens to a community of volunteers to help manage stormwater and keep them free of trash and debris.

Read More
Jornal da Cidade - 33

Upgrading city maps for easier commute in California

A US transportation authority builds intuitive maps for California residents and improves daily commute around Solano county.

Read More